Introduction
Few things make me more conscious about the environment and climate than my commute back from work in the summer. I am surrounded by impatient drivers piled up at intersections, heavy engines from nearby work trucks buzzing with vengeance and pumping foul fumes into the air. My discomfort is amplified by the oppressive heat and the barely functioning air-conditioning system of the 2009 sedan I drive. Unfortunately, I picture this when I think about summer, not blue skies, gentle breezes, and peaceful ocean waves.
All this has raised my curiosity about cars. Automobiles are incredible machines. Think about the complexity of an internal combustion engine. A heavy piece of steel called a piston creates a gap, drawing in air. A fuel injector sprays a precise quantity of gasoline into the chamber. The piston compresses the mixture, while an electrical source ignites the pressurized mixture, and the piston explodes downward, then back up to expel the spent fuel. This happens thousands of times a minute in a gasoline-fueled car and the engine somehow can handle this task for years with minimal maintenance. But what happens to the expelled combustion elements? It gets sent out the exhaust of your car as a mixture of carbon monoxide, carbon dioxide, methane, nitrogen oxides, and other assorted pollutants. Not only does this contribute to the greenhouse gases of our atmosphere, it worsens local air pollution and creates smog.
Thankfully, it turns out automobile manufacturers have made a lot of progress in reducing these pollutants, thanks in part to higher efficiency in converting chemical into mechanical energy as well as catalytic converters that capture certain pollutants. What more, now we have electric vehicles which nearly eliminate pollutants altogether. This is because combustion is replaced by the simple mechanism of electromagnetic fields generated from battery power directly spinning the wheel, without the added (and inefficient) complexity of having to convert the chemical energy of fossil fuels into the vertical motion of pistons and then into the rotation of the crankshaft.1
In this post, I take data provided on the Bureau of Transport Statistics website and sourced from the EPA to analyze trends in emissions (measured in grams per mile) from gasoline and diesel vehicles in the US. If, for example, the transition to EVs ends up slowing down, it would be comforting to see ICE vehicles reducing their emissions nonetheless. The data is broken down by vehicle and fuel type, but the EPA also computes average emissions across all vehicle/fuel types. This average takes into account the age distribution of the national fleet, regulatory changes, and typical driving behaviors like speed or idle time. Note that technological improvements in ICE engines will not immediately show up in the average car (which is several years old).
This won’t be a tutorial in ggplot like my previous posts, but I will use it to show off my ggplot skills nonetheless. The code and input data can be found on my GitHub repository. Moreover, I am not very familiar with cars, so a lot of my conclusions are speculative in nature. I’m sure I will make some embarrassing errors with auto technology, if I have not already.
Relative Reduction by Pollutant
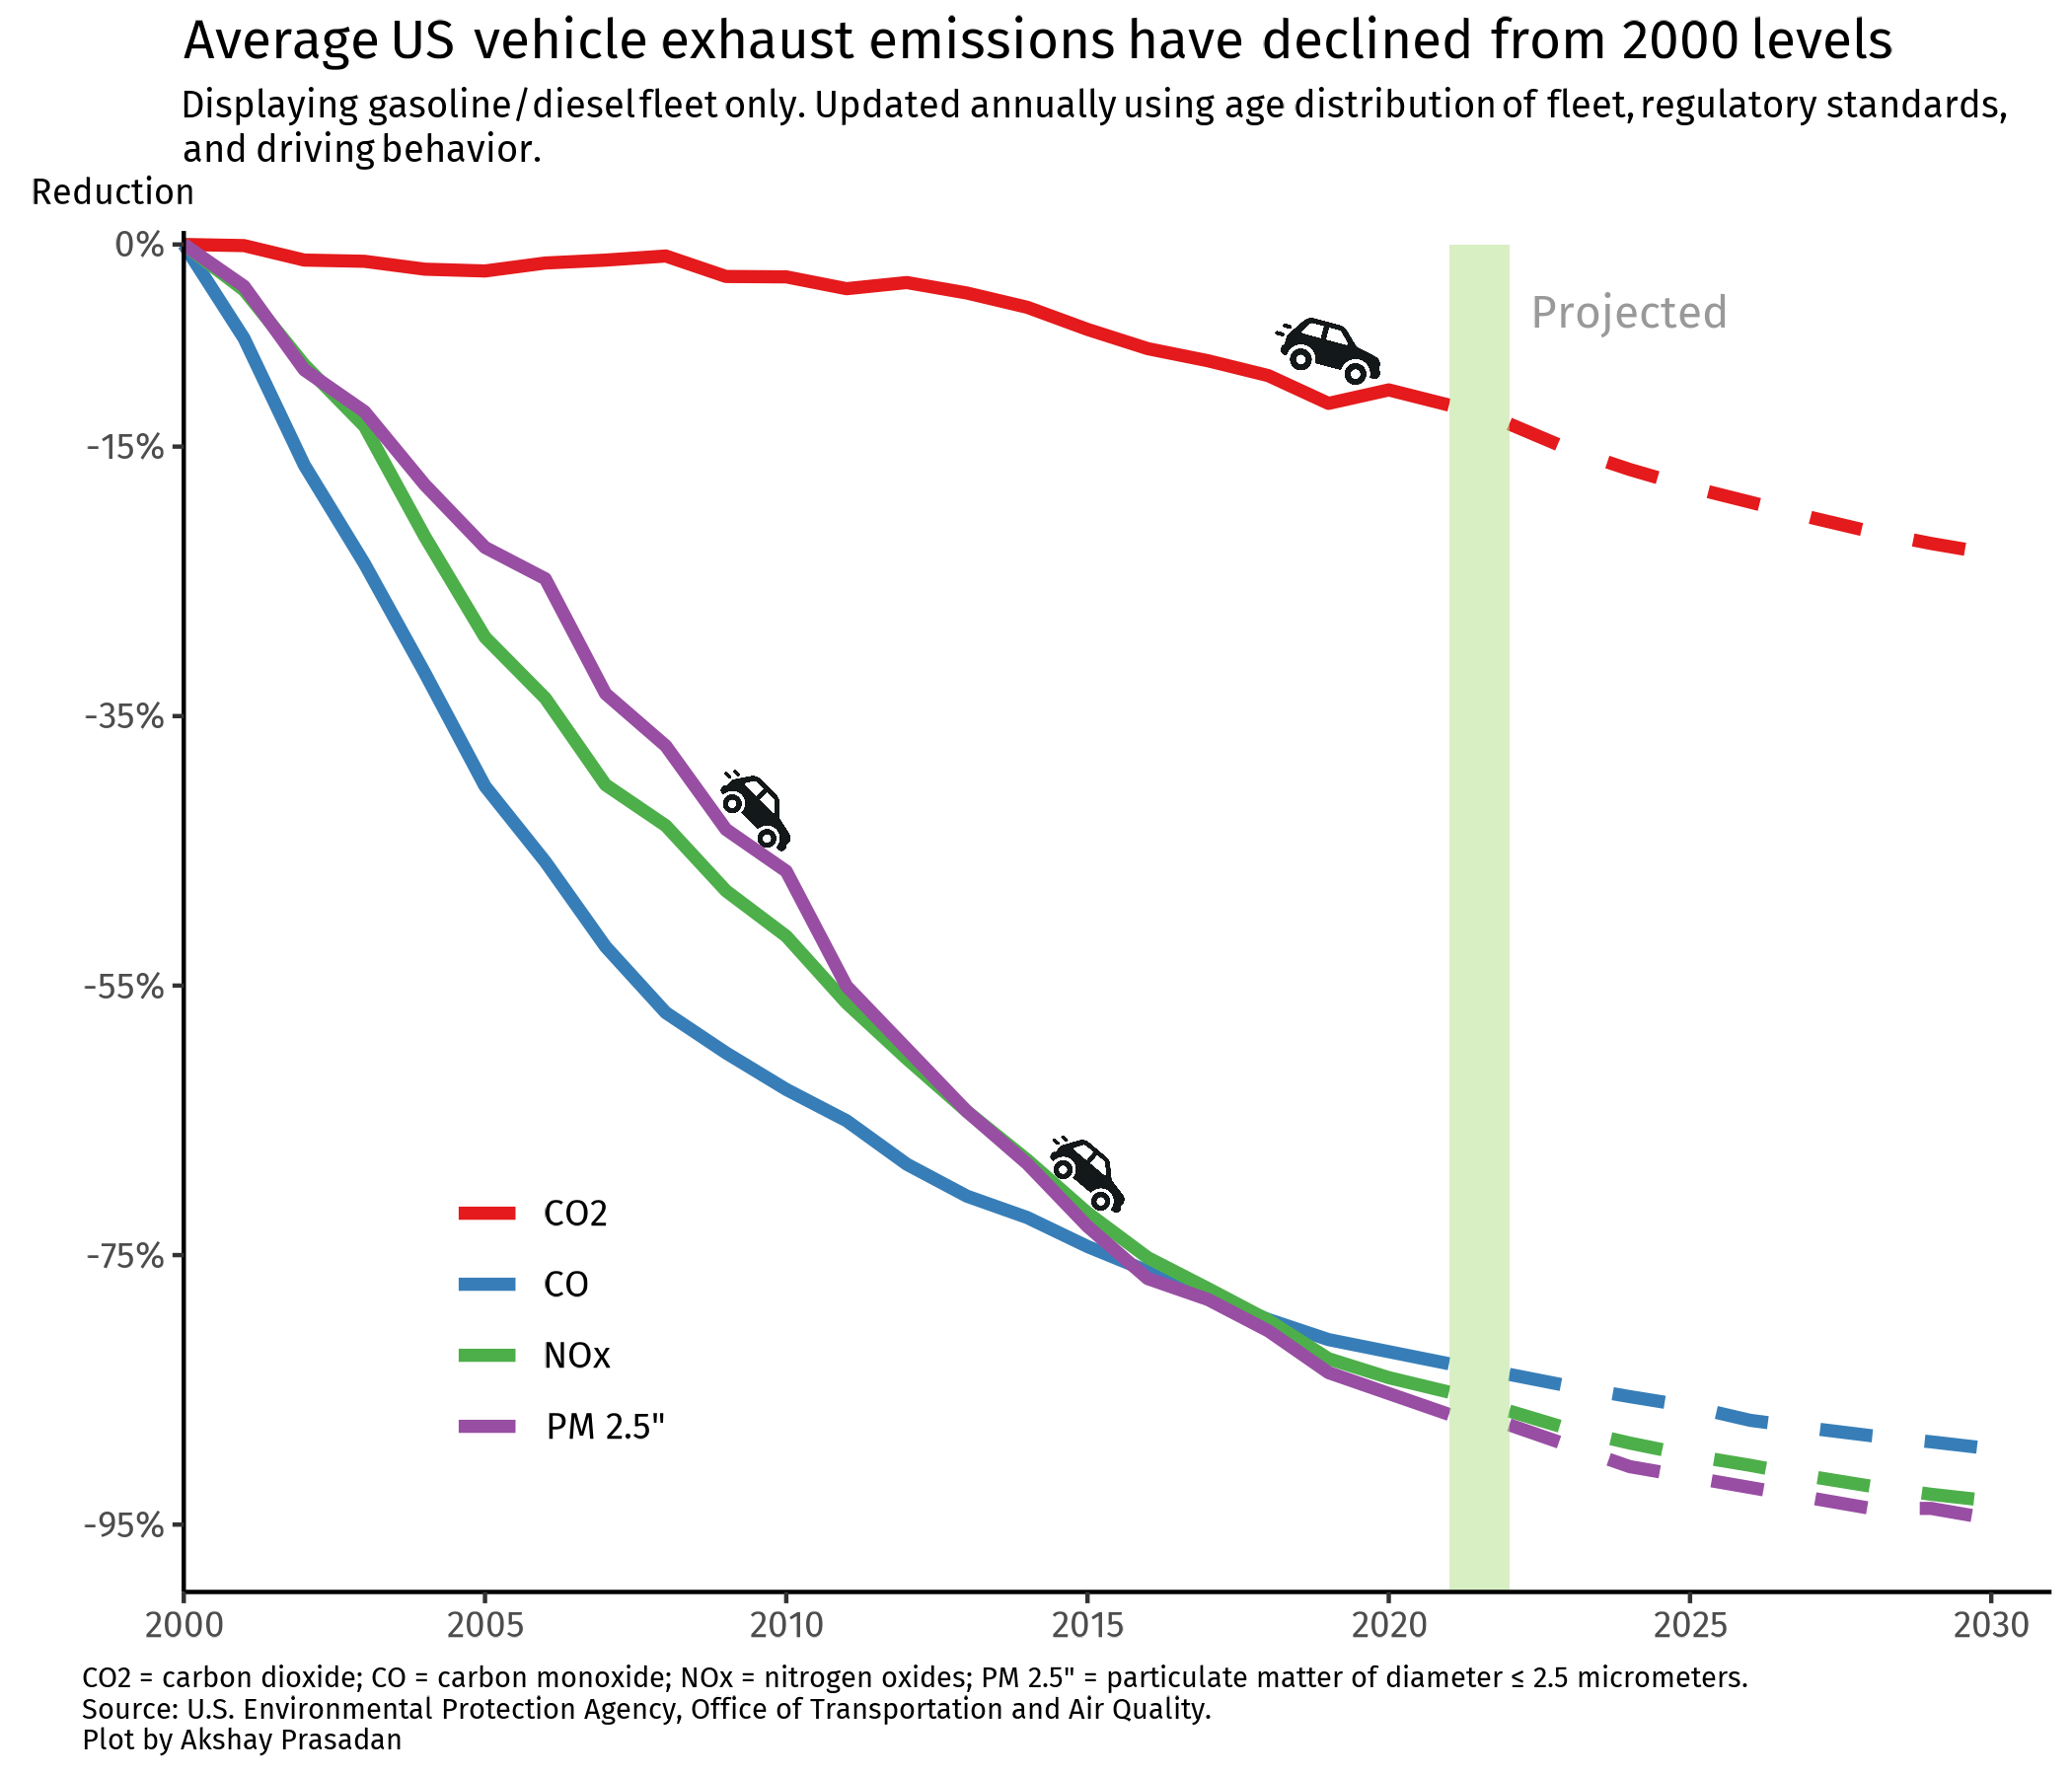
Let’s start by just looking at the trends in average per vehicle pollutants, which are measured in grams per mile. As mentioned before, this is not showing the pollution of the latest ICE vehicles of that year, but the pollution of the average gasoline or diesel fueled car on the road in the US. This average also takes into account the distribution of cars, buses, small and large trucks, and motorcycles. It ignores the reduction of emissions from EVs taking a greater share of the national fleet. In the first plot, I will just look at relative changes, since it’s hard to compare the absolute gram per mile quantities from different pollutants.
There has been a dramatic decrease in all of the exhaust emissions except for CO2. I suspect this is likely fueled by improvements in catalytic converter technology. Catalytic converters reduce the carbon monoxide, nitrogen oxide, and particulate matter emissions and output water and CO2. Perhaps that’s why CO2 is not falling as rapidly, since it is viewed as less potent than the other emissions. I hypothesize that to reduce CO2 emissions per mile traveled, the focus will be on better engine efficiency, e.g., miles per gallon. Catalytic converters are less relevant here.
Relative Reduction by Pollutant, Vehicle Type, and Fuel Type
Let’s now break down the previous plot by the type of vehicle. Again, we stick with the relative reductions since we are comparing several pollutant types on the same plot.
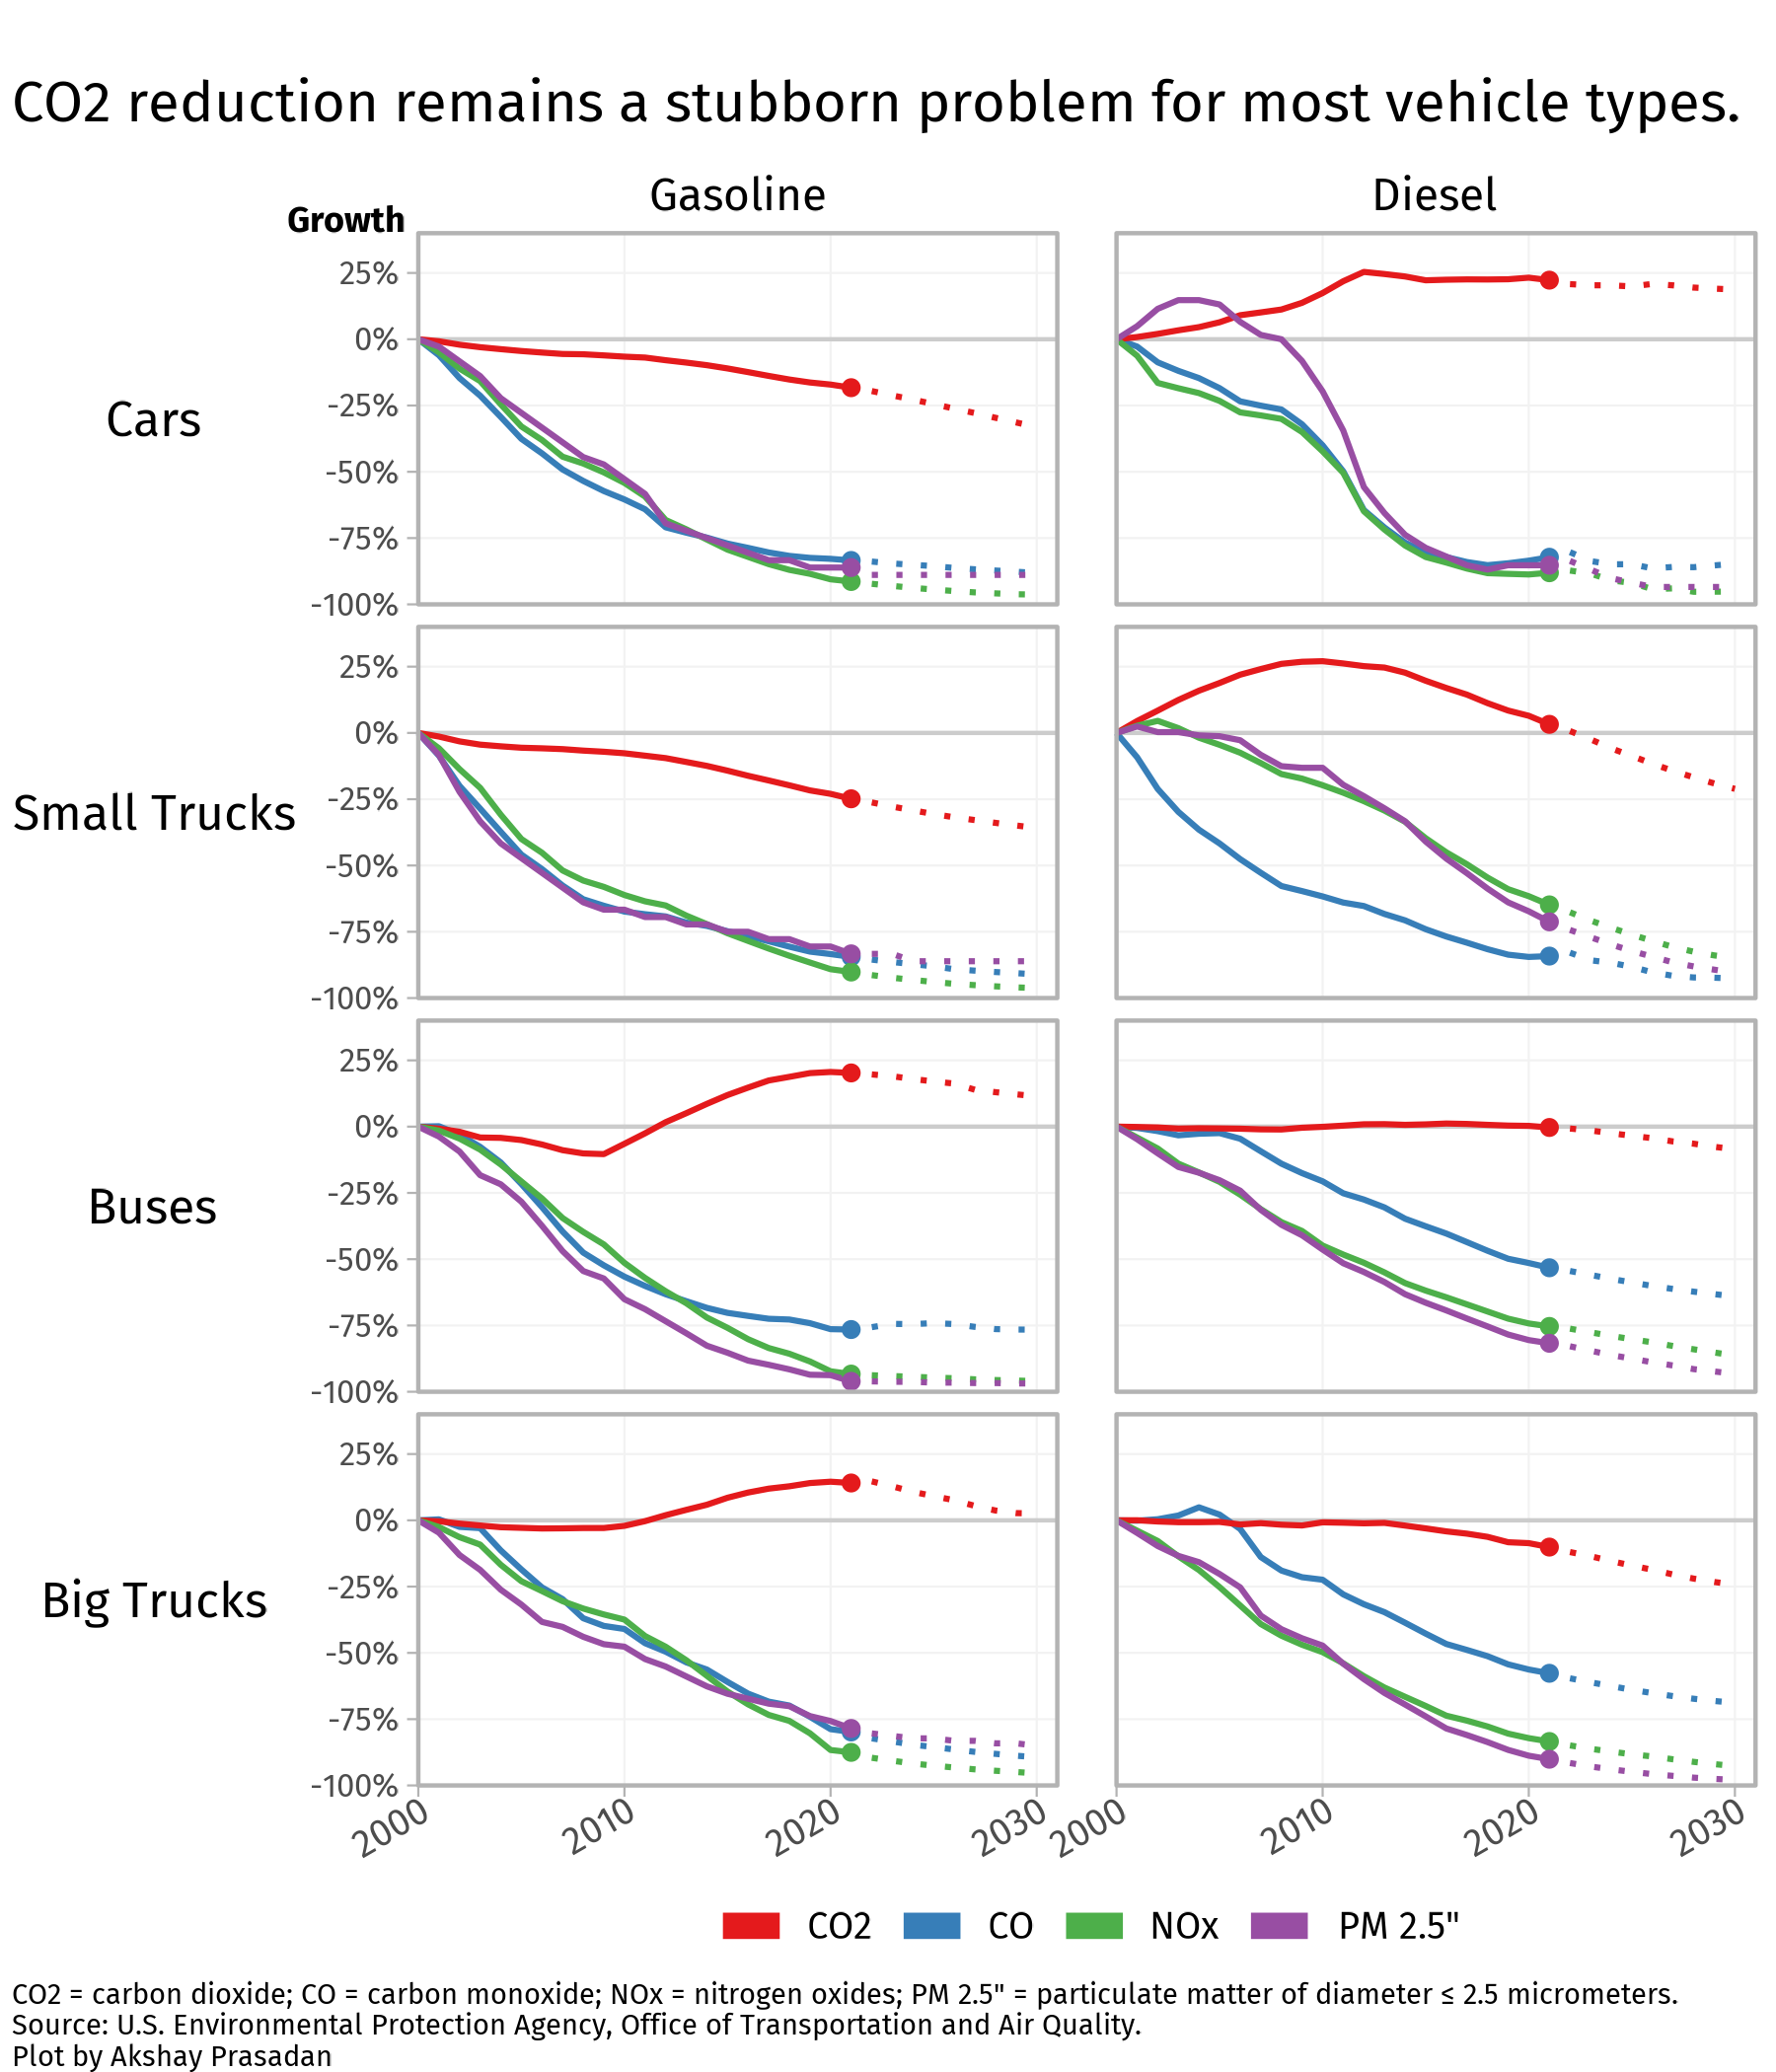
Surprisingly, CO2 emissions have risen for gasoline-fueled buses and large trucks, as well as diesel-powered cars. However, I suspect the sheer quantity of gasoline cars and small trucks in the US is over-powering those trends and leading to the downward trajectory from the previous plot (buses aren’t as common as they should be in the US). Meanwhile, all vehicle types are easily reducing NOx and CO pollution.
I was also surprised that diesel is hardly showing any improvement in CO2 emissions. But I believe diesel has a head start by already being more efficient than gasoline cars, so perhaps it is harder for diesel cars to achieve the same reduction that gasoline cars have. The next section will better clarify this trend by looking at the absolute figures.
Absolute Emission Levels by Vehicle and Fuel Type
Let’s now focus on CO2 emissions of the pollutants, which is less relevant to smog or acid rain, but is of high importance to global greenhouse gas concentrations.

This was totally unexpected. Excluding cars, CO2 emissions for diesel-fueled vehicles (the dotted lines) are uniformly worse in absolute terms. For cars, diesel had an advantage but gasoline has taken the lead in the last decade. I guess I don’t fully understand from this data why I hear that diesel is supposed to be more energy efficient than gasoline. There might be differences in diesel vehicles in the US versus Europe, or the diesel fleet is different in nature than the gasoline fleet within each vehicle type. For example, it could be that diesel is more efficient on a per person-mile basis for buses.
Is diesel still worse in nitrogen oxides? Unfortunately, so.

In all plots, buses and large trucks are the worst offenders. But to their credit, buses are far more efficient on a per person-mile basis. How many sedans can a single bus in an urban metro replace? Moreover, large trucks are likely transporting economically significant cargo on routes not supported by rail and to the benefit of many people.
Final Remarks
My next area of research is figuring out what the real advantage of diesel engines is supposed to be. Diesel engines are significantly different than gasoline in the actual combustion stages. For example, gasoline engines have an electrical ignition source to trigger the combustion, while the piston of a diesel engine instead compresses the air/fuel mixture so much that the pressure and heat alone triggers combustion. How do these differences translate to different pollution levels? Is it the actual chemical form of diesel at play?
All this said, I confess that I do like the sound of a diesel engine. They seem to have a lower frequency ‘purr’ that is more satisfying to hear when hitting the pedal. But if this comes at the cost of emissions, I won’t miss it.
Footnotes
Of course, EVs that charge from a dirty electric grid contribute to emissions indirectly, and the environmental impact of the mining and processing of key metals for the battery should not be ignored. But I think these criticisms are often exaggerated for political purposes, and in the net, the transition to EVs from ICE vehicles will be a net positive for the world.↩︎
Citation
For attribution, please cite this work as:
Prasadan, Akshay. 2025. “Auto Pollution? I’m Tired and Exhausted
of It!” June 7, 2025. https://akprasadan.github.io/posts/2025-06-07-auto-emissions/.